Exploring Employee Engagement
Boosting employee engagement is critical to creating a successful workplace.
Listening to employee voices increases motivation and satisfaction, leading to well-being and higher productivity—an opportunity no workplace should miss out on.
We have extensive experience with employee engagement surveys, and worked with Strathcona County to refresh their approach to their employee engagement survey in 2023. Our work included setting their process up for success with a secure, dynamic reporting system that ensured leadership would see the big picture of their workforce.
What We Did
We collaborated closely with the County HR team to ensure the survey process would lead to actionable insights for their team. We:
Refreshed the survey design to address new priorities while preserving trending.
Used our customized benchmarking process to elevate the analysis.
Integrated the County’s existing Microsoft systems to provide a secure, dynamic, and insightful dashboard.
Method Mix & Sampling Snapshot
- The survey was delivered online, with employees receiving an email invitation with a unique link.
- Over 2,000 employees were invited to receive the survey.
- The survey was open for three weeks and closed with a margin of error of ±2% at the 99% confidence level.
- The response rate was 66% –well above the benchmark average, and with a greater number of participants than the previous year.
Solution & Deliverables
Analytics Techniques
- The results were segmented by a number of demographics, including department and years of service, so the County could understand how different factors affected the employee experience.
- Our qualitative analysis categorized open-ended response data into key topics so the County could quickly understand the key ideas from employee’s comments.
Strategic Survey Redesign
For long-running employee engagement surveys, it’s important balance addressing fresh priorities with preserving the ability to compare the data year-over-year.
We used our expertise in survey design to make recommendations and navigate requested changes, such as adjusting the Likert scale used for the quantitative questions. The previous survey iteration had used a 6-point scale, and the County wanted the 2023 to use a 5-point scale, which provides a truly neutral response option. We used advanced statistical techniques to update the scale while ensuring past results would still be comparable to the 2023 results.
Relevant Benchmarks
Sometimes it isn’t enough to measure employee engagement: comparison can help an organization know where it stands in relation to its peers.
A common benchmarking approach is for a firm to only use data from surveys they have managed compiled into a benchmark or index measure for that sector. These indexes lack key contextual data, such as the survey year, organization size, and other factors affecting engagement score. Only using data from surveys managed by a single company can also create bias, as the resulting index may be affected by that firm’s unique approach.
Instead, our approach is to gather data from public sources to add to our database, investigating provincial and federal sources, open data sets, news reports, organization annual reports, reports to governance boards, and more. This way, the information and source is always transparent and official.
We researched and obtained relevant benchmarks on employee engagement from municipal governments both in Alberta and across Canada. We advised the County on differences and similarities and how they would inform the resulting action plans.
Integrating Existing Security Credentials with a Dynamic Dashboard
Municipalities and similar organizations often need reporting options that use their existing systems and credentials so they can ensure efficiency. Our tailored PowerBI dashboard for municipalities integrates with existing Microsoft and HR systems to use existing security credentials so users can only see the data that is relevant to their unit. We pay close attention to anonymity—segments with fewer than 5 respondents were automatically masked so that no individual could be identified.
Our PowerBI dashboards are dynamic, providing users with the ability to drill down into the results to fully understand the data and what it means for their organization. Our graphs and charts are creative with the aim of being user-friendly and interactive to deeply engage the user. Overall, we worked with the County to ensure reporting would provide actionable insights to management so they could improve their workplace.

Council Presentation – September 2023
In September, 2023, Kai Analytics Founder and CEO Kevin “Kai” Chang presented the survey results to the Strathcona County municipal council. This presentation was recorded, and this is a screenshot of the event.

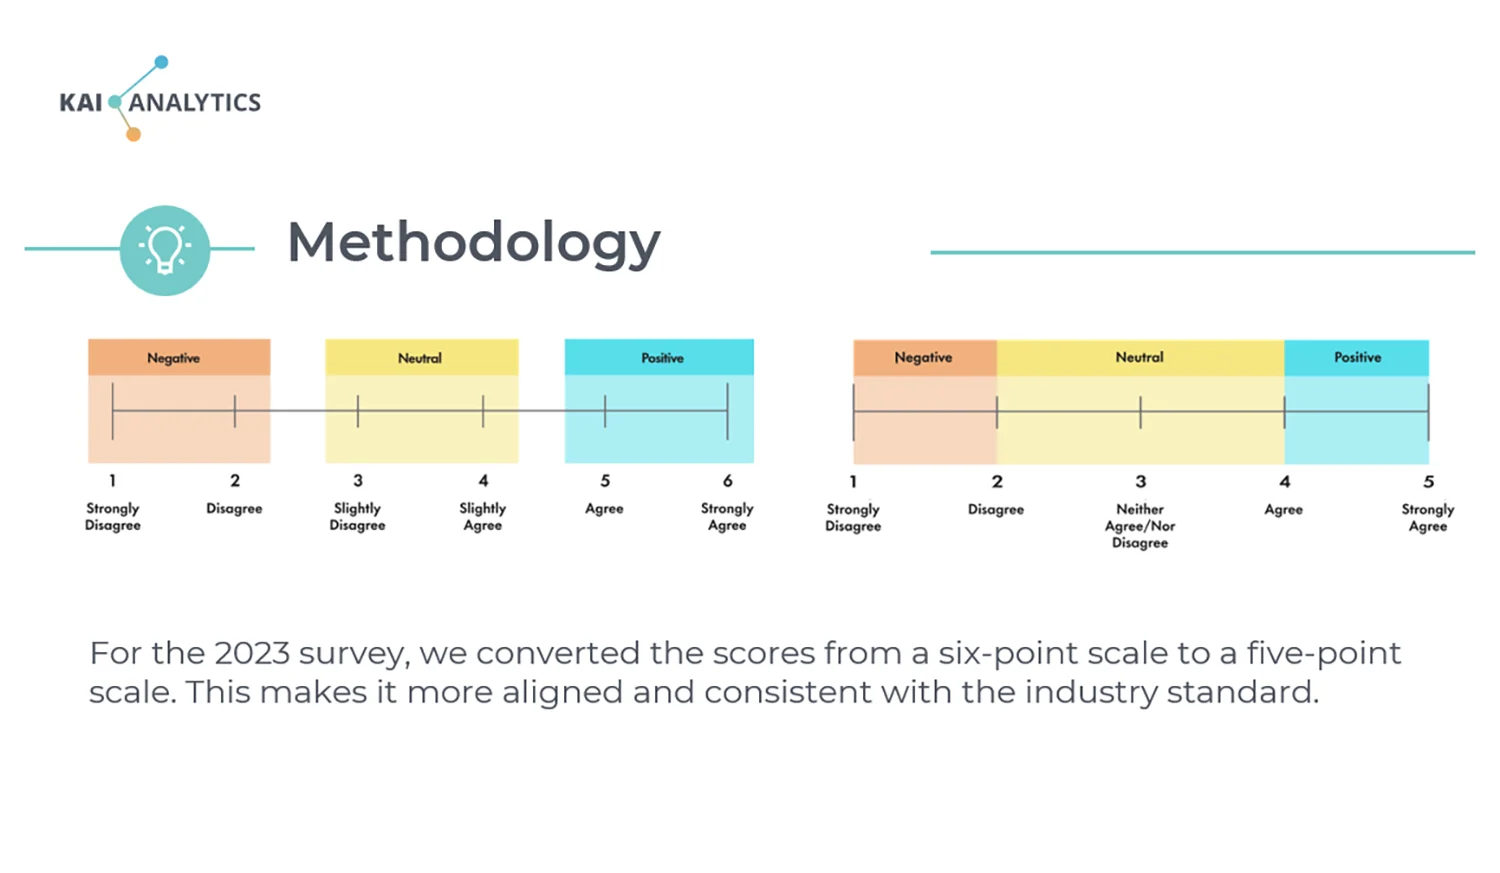
Presentation - Methodology
A slide from our presentation to the Strathcona County municipal council in September, 2023. In it, we explain the difference between the previous and current Likert scales.
Results & Impact
The results of the survey allowed the County to carry out action planning to bolster areas of strength and strategize over areas for improvement. In 2025, we followed up our previous efforts with a pulse survey, building on our work with new data.
Secure Internal Transparency
Big-Picture Qualitative Analysis
Result Metrics
- Kai Analytics presented the results to County executives and answered their questions about the results.
- Kai Analytics met individually with unit leaders who had questions about their dashboard data to support their action planning.
- A pulse survey took place in 2025 to test the effectiveness of strategic planning initiatives.